Coordinate Geometry
Instruction
Coordinate Geometry
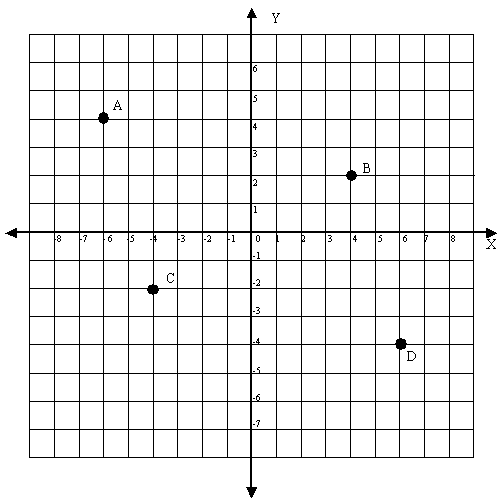
In the following diagram the “x – axis” and the “y – axis” represent 0 and divide positive and negative integers from each other. Integers increase as you go from the left to the right of the diagram, and from the bottom to the top.
You can plot the points on this diagram, by indicating which coordinate the point falls on both the x and y axis (the x-axis is always listed first – called the abscissa while the y-axis is always listed second – called the ordinate). For example:
Point A (-6,4)
Point B (4,2)
Point C (-4,-2)
Point D (6,-4)
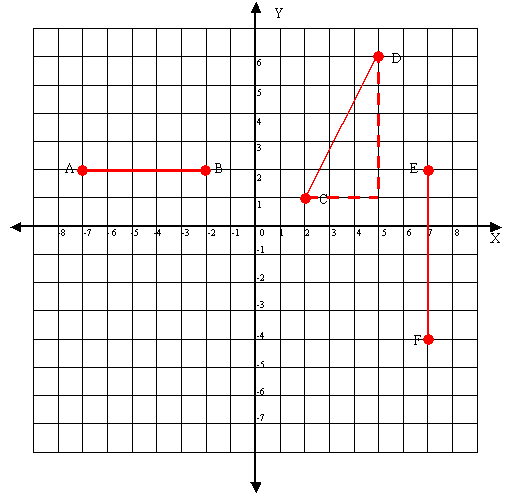
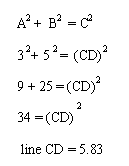
The lengths of lines can be determined on plots by counting the number of units between each end point. For example Line AB = 5 units long and line EF = 6 units long. You can solve the length of line DC by using the Pythagorean Theorem.
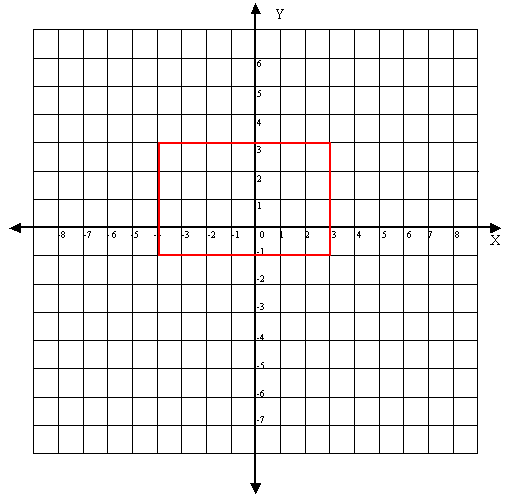
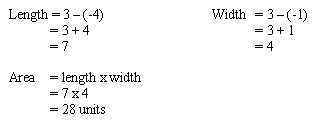
To determine the area of the rectangle above, simply determine the length and widths and follow the standard formula for calculating area.
